
Performance optimization with native execution engine for Fabric Spark
See how Microsoft Fabric’s Native Execution Engine takes Apache Spark performance to the next level with Velox and Apache Gluten. Find out how native C++ execution and columnar processing can speed things up, plus check out real-world test results in this hands-on comparison.
Published March 03, 2025

Part 2: Microsoft Fabric admin - Adding Entra ID groups to workspaces with Semantic Link and Python
Learn how to add Entra ID security groups to workspaces in Microsoft Fabric / Power BI using Semantic Link and Python.
Published October 26, 2024

Microsoft Fabric admin: First thoughts and use cases on using Terraform for Infrastructure as Code (IaC)
Learn how to automate Fabric Admin tasks using Terraform as Infrastructure as Code (IaC). Discover how to create workspaces in Fabric / Power BI, assign Fabric capacity and add users / security groups to the workspace.
Published September 29, 2024
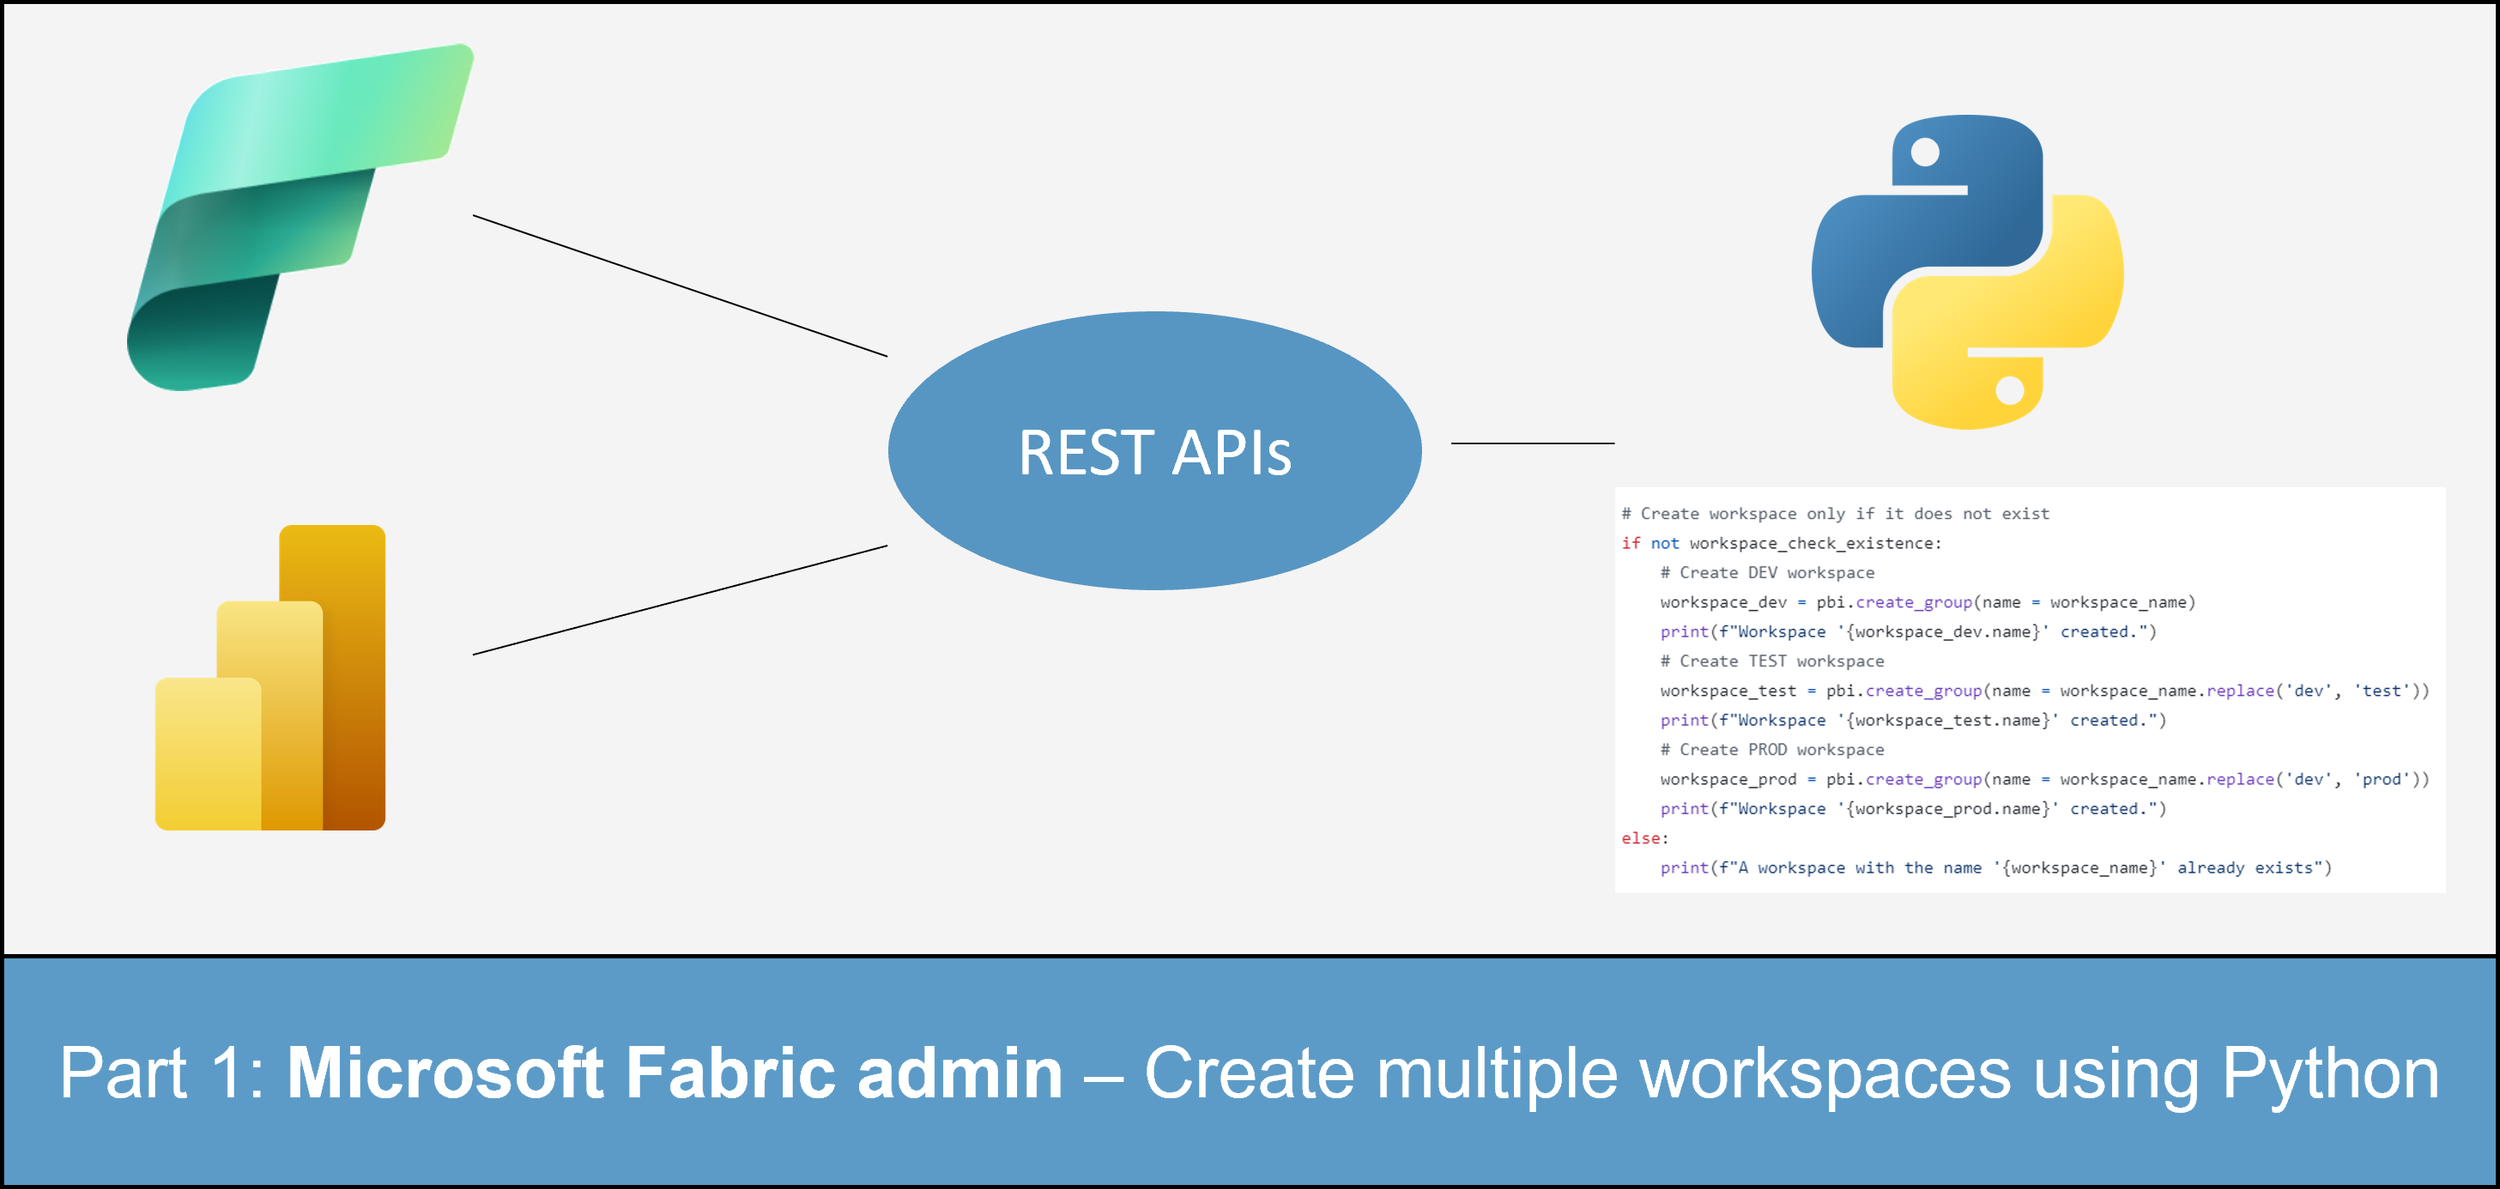
Part 1: Microsoft Fabric admin - How to create multiple workspaces using Python
Learn how to automate the creation of multiple workspaces in Microsoft Fabric / Power BI using Python and REST APIs from Fabric and Power BI.
Published August 07, 2024

How to switch report live connection using Power BI Developer Mode
Learn how to switch report live connection to a local connection without needing to republish the semantic model using the Power BI Developer Mode (pbip folder structure).
Published April 30, 2024
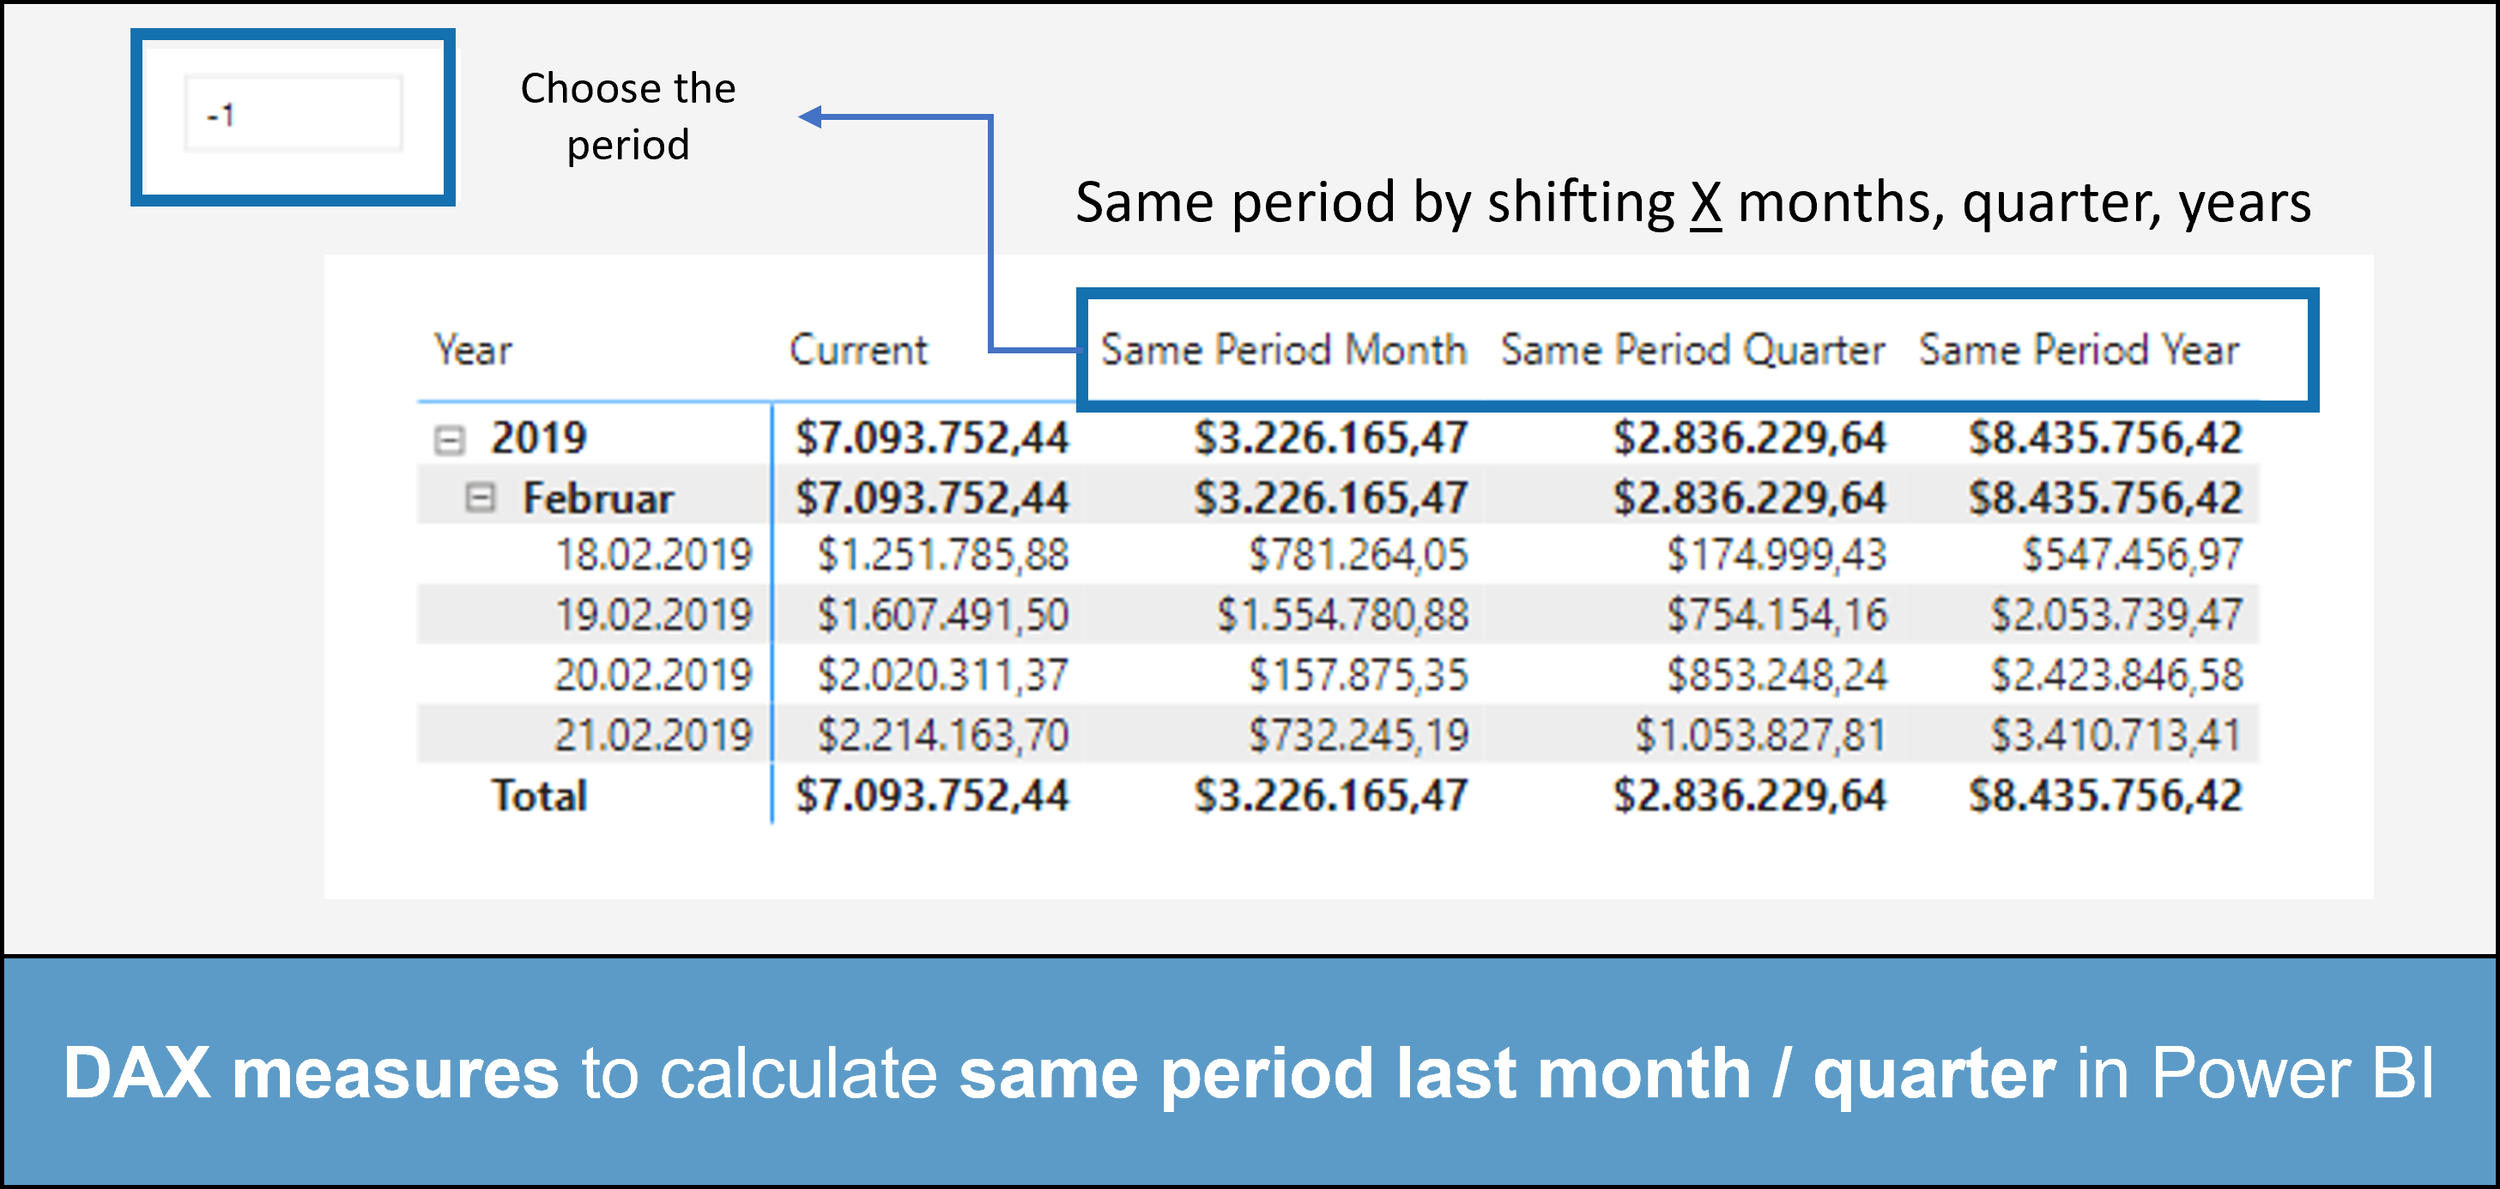
DAX measures to calculate same period last month / quarter in Power BI
Create customized DAX measures to calculate same period last month and quarter inside of a calculation group in Power BI.
Published March 22, 2024

Performance impact of visual calculations using DirectQuery in Power BI
Exploring the performance impact of visual calculations in Power BI and how it can be used to optimize DirectQuery mode.
Published February 22, 2024
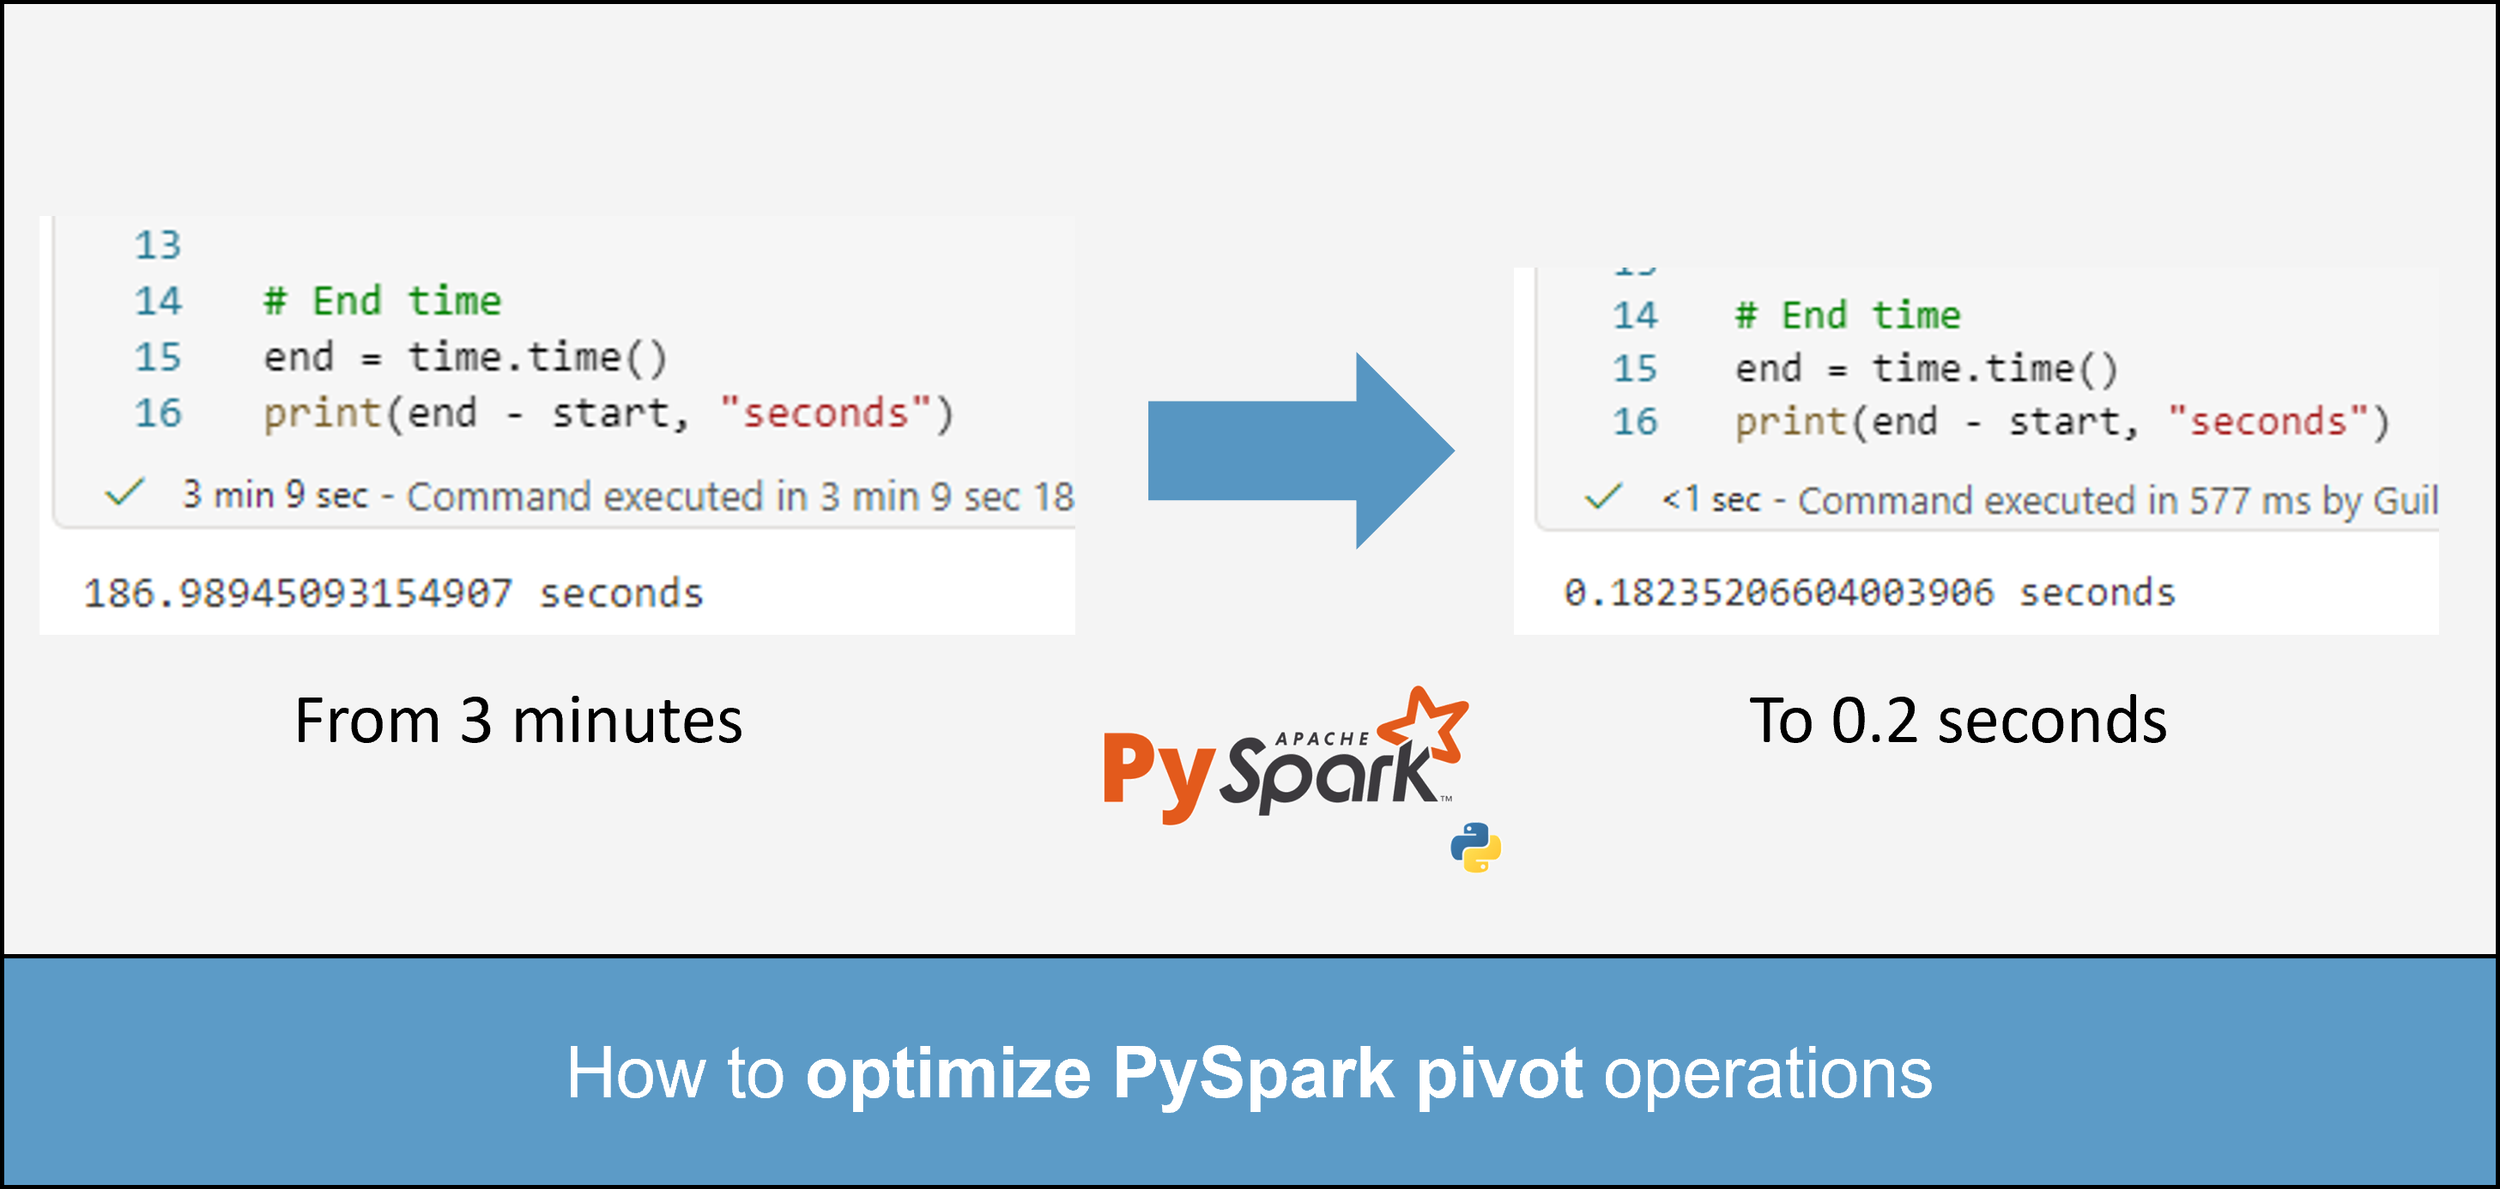
How to optimize PySpark pivot operations
Experiencing performance issues with PySpark pivot operations? Discover a simple trick to optimize and drastically improve performance in PySpark pivoting.
Published January 18, 2024

Milestone trend analysis visual in Power BI with Deneb
Learn how to create a Milestone Trend Analysis (MTA) in Power BI with Deneb custom visual using Vega-Lite.
Published December 24, 2023
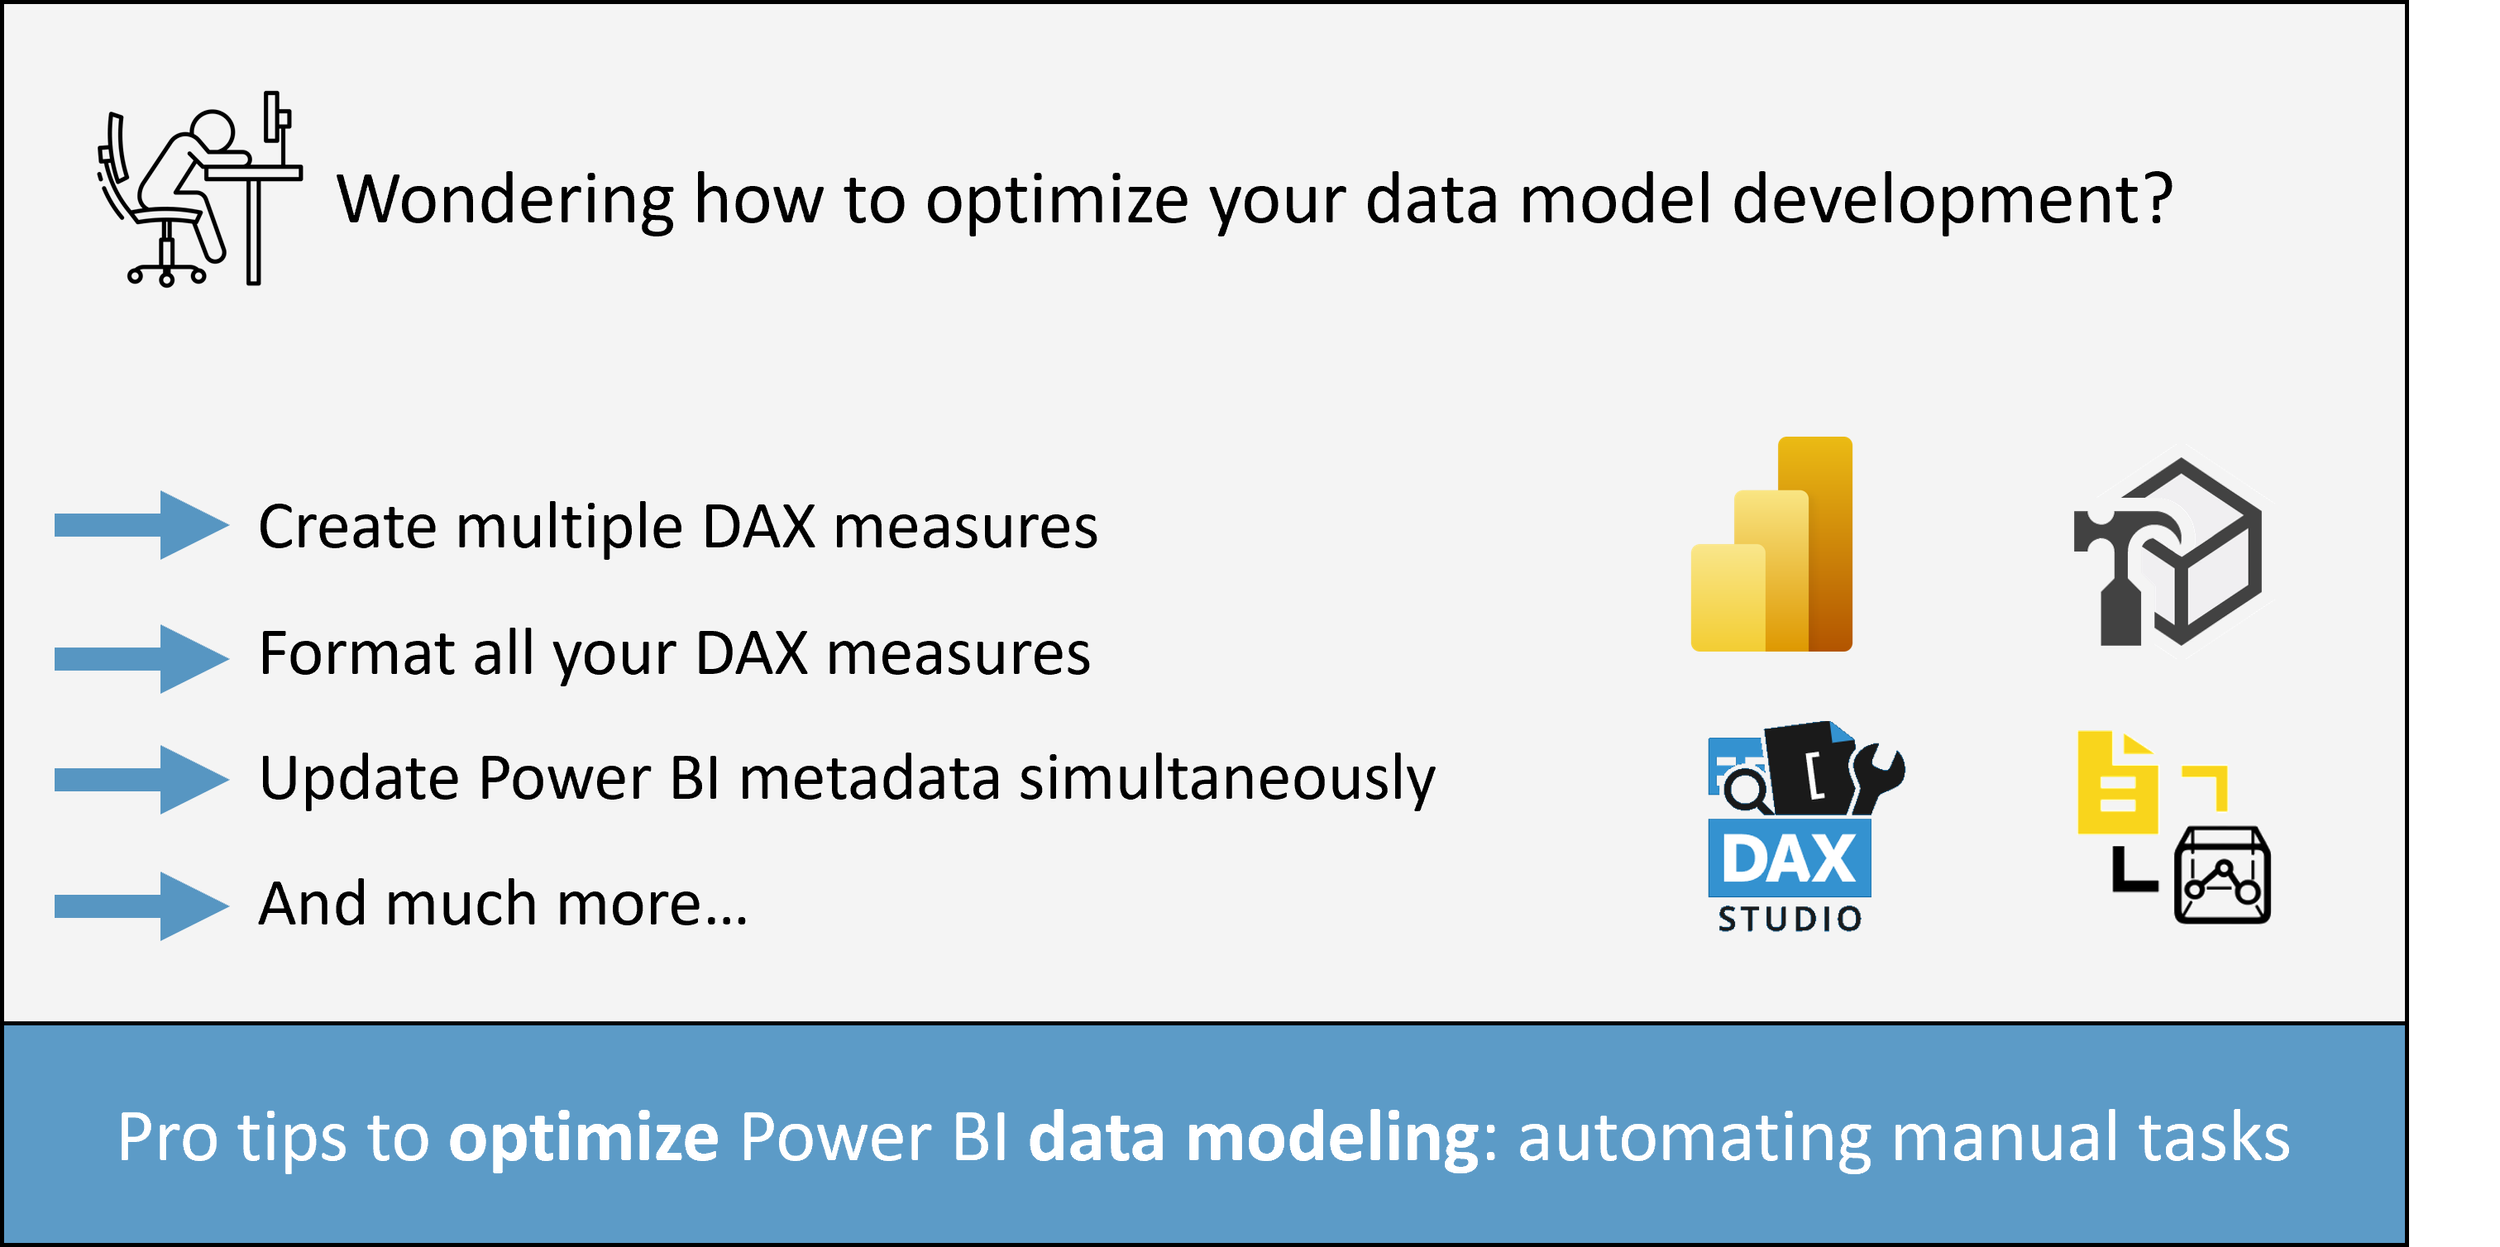
Pro tips to optimize Power BI data modeling: automating manual tasks
Optimize your Power BI data modeling development. Explore advanced techniques, from creating DAX measures in Tabular Editor with C# to ensuring referential integrity. Accelerate development with efficient DAX formatting, robust date tables, metadata updates, source connection parameterization and more.
Published December 13, 2023
Leveraging Power BI REST APIs: Python automation for dataset refresh and Microsoft Teams notification
Learn how Python elevates Power BI with REST APIs, enabling robust dataset refresh monitoring and immediate Microsoft Teams notifications for any dataset refresh failure in your analytics pipeline.
Published November 08, 2023

Parent-child hierarchy without parent key column in Power BI using Python
Learn how to create parent-child hierarchies without a parent key column in Power BI using Python!
Published October 15, 2023

How to apply dynamic conditional formatting in a text box in Power BI
Are you looking to master dynamic conditional formatting within text boxes in Power BI? Have you ever wondered how to implement dynamic conditional formatting in a text box in Power BI? If yes, then this article is a must read for you!
Published October 06, 2023

How to add a custom Python package in Azure Synapse Analytics
Do you often find yourself repeatedly using the same Python functions across multiple notebooks, and are you looking for ways to streamline your workflow? If so, this article is a must-read for you. Discover how to optimize your process and boost your productivity!
Published September 13, 2023
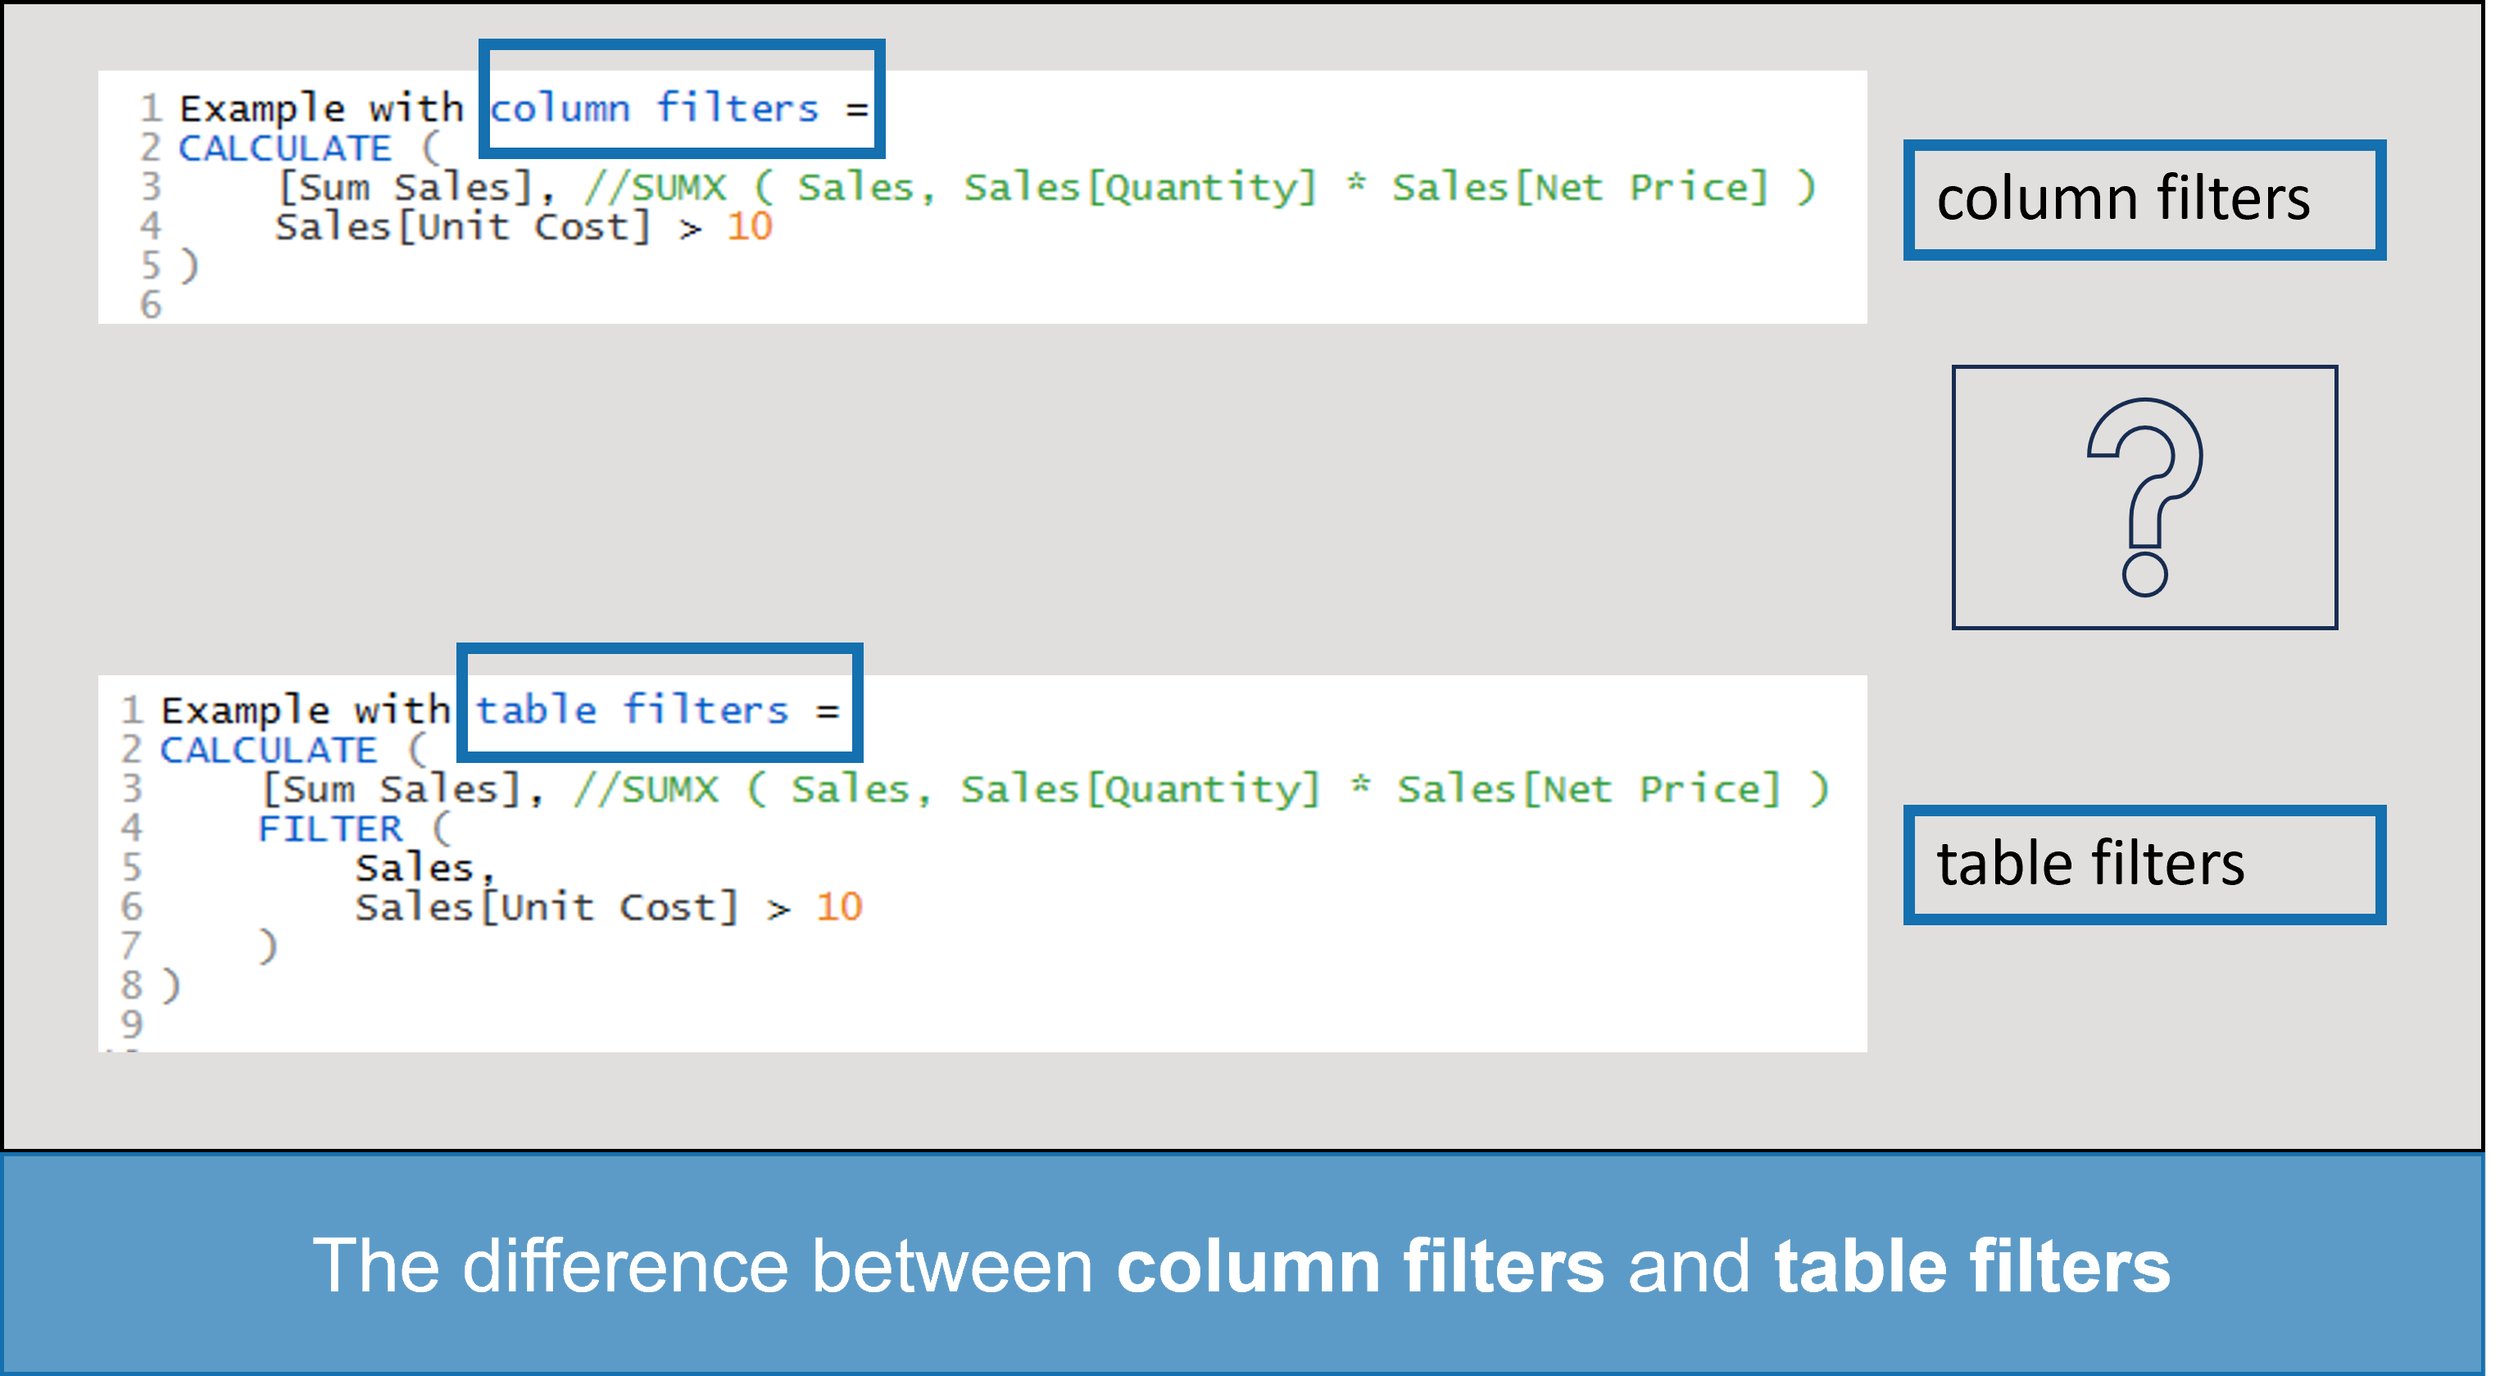
Table filters vs column filters in Power BI and the concept of expanded tables
Are you using table or column filters in your DAX measures? There's a big difference between the two, and it can have a big impact on performance. In this article, I will explain the difference between table and column filters, the concept of expanded tables, show you how they impact performance, and give you 2 examples of how to use table filters effectively.
Published September 2, 2023